Introduction
This Shiny App was built to allow you, the user, to easily look at the biodiversity data from EDI and NEON.
Step 1: Search Data
Type any word from the title, description, or abstract of the EDI or NEON data. Any datasets that meet that criteria will be shown on the dropdown menu below the search bar. To get more detailed informa about the datasets, hit the search results tab above.
Step 2: Read Data
Select the data set that you wish to download/interact with. If the selection is a NEON dataset, an additional window will pop-up allowing you to specify which dates and sites you want data from
Step 3: Plotting
Once your dataset is downloaded, a list of plotting functions will appear in another dropdown menu. After selecting the plotting function, parameters to change the plot will be listed below. Use the question mark button for more information on individual parameters. After hitting plot, press the plot tab above this window. This tab will display the graphs returned from the plotting functions.
Other tools
If you like the dataset you downloaded and plan to use it again in the future. Hit the Save Data button. This will download the dataset as an RDS file to the directory this app located in. In order to use downloaded datasets, hit the browse button and select the dataset you would like to load in. If you would like to take a quick peak at the dataset before downloading it. Click on the dataset tab above this window.
Tutorial
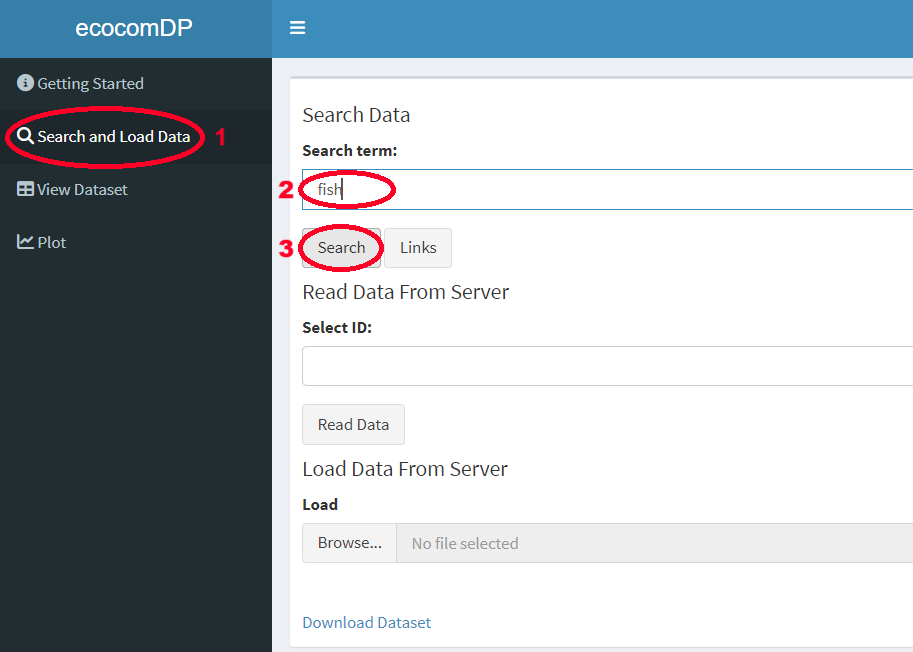
Step 1: Search Data
1) Open "Search and Load Data" tab. 2) Type in the desired search term. 3) Click the Search button.
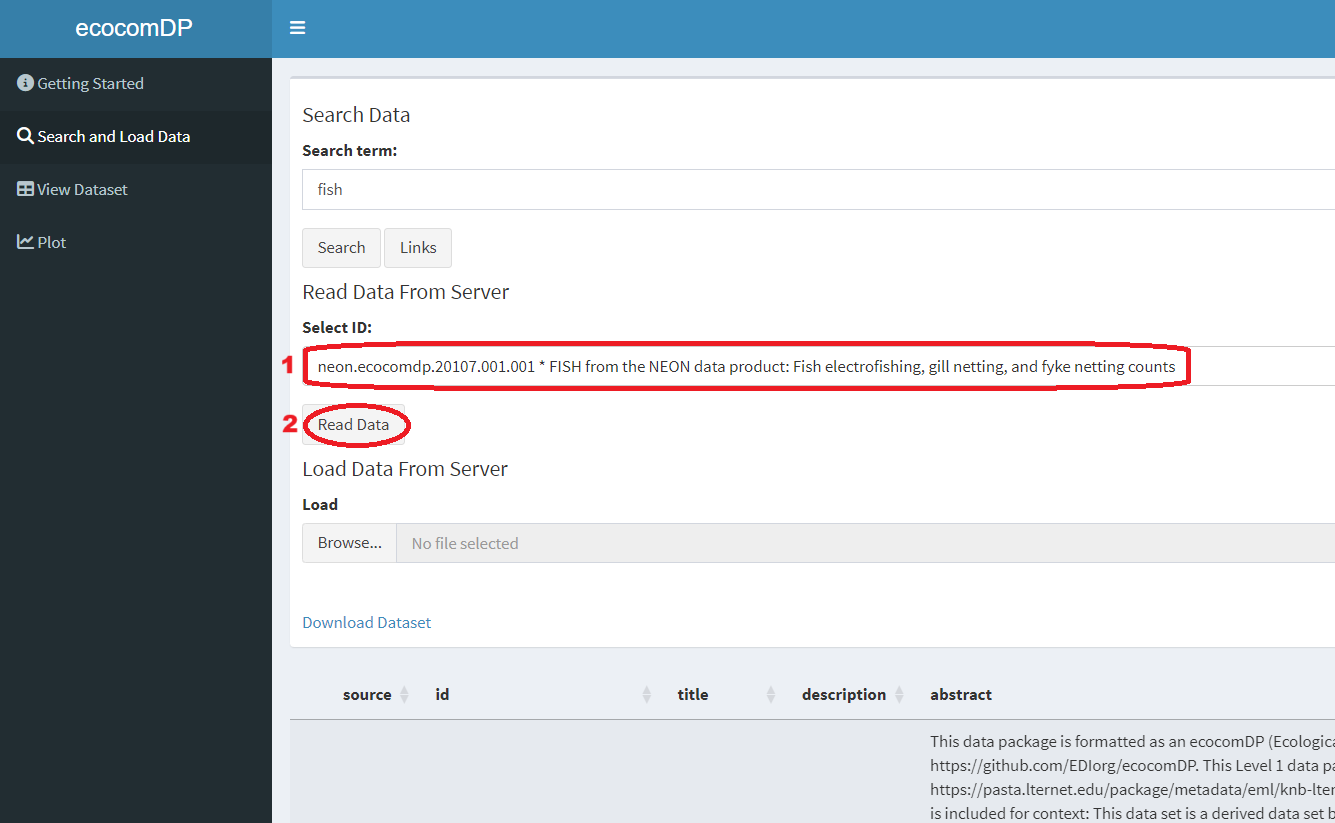
Step 2: Select and Read Data
1) Select a dataset from drop-down menu or scroll through the results window in the bottom half of the page. 2) Click the Read Data button.
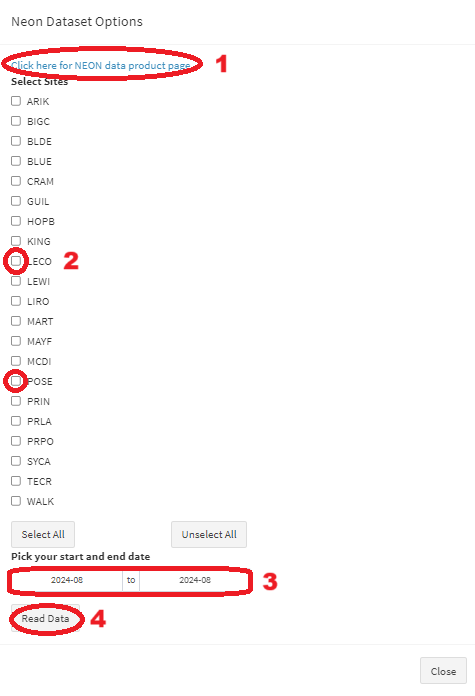
Step 3: Read Data
If a NEON dataset is selected, you will see this window. 1) Click the link to explore the NEON data product page for the selected product. This can be used to find the available data for select sites and times. 2) Select the desired sample sites. 3) Select the desired sampling dates. 4) Click the Read Data button.
Step 4: View Data
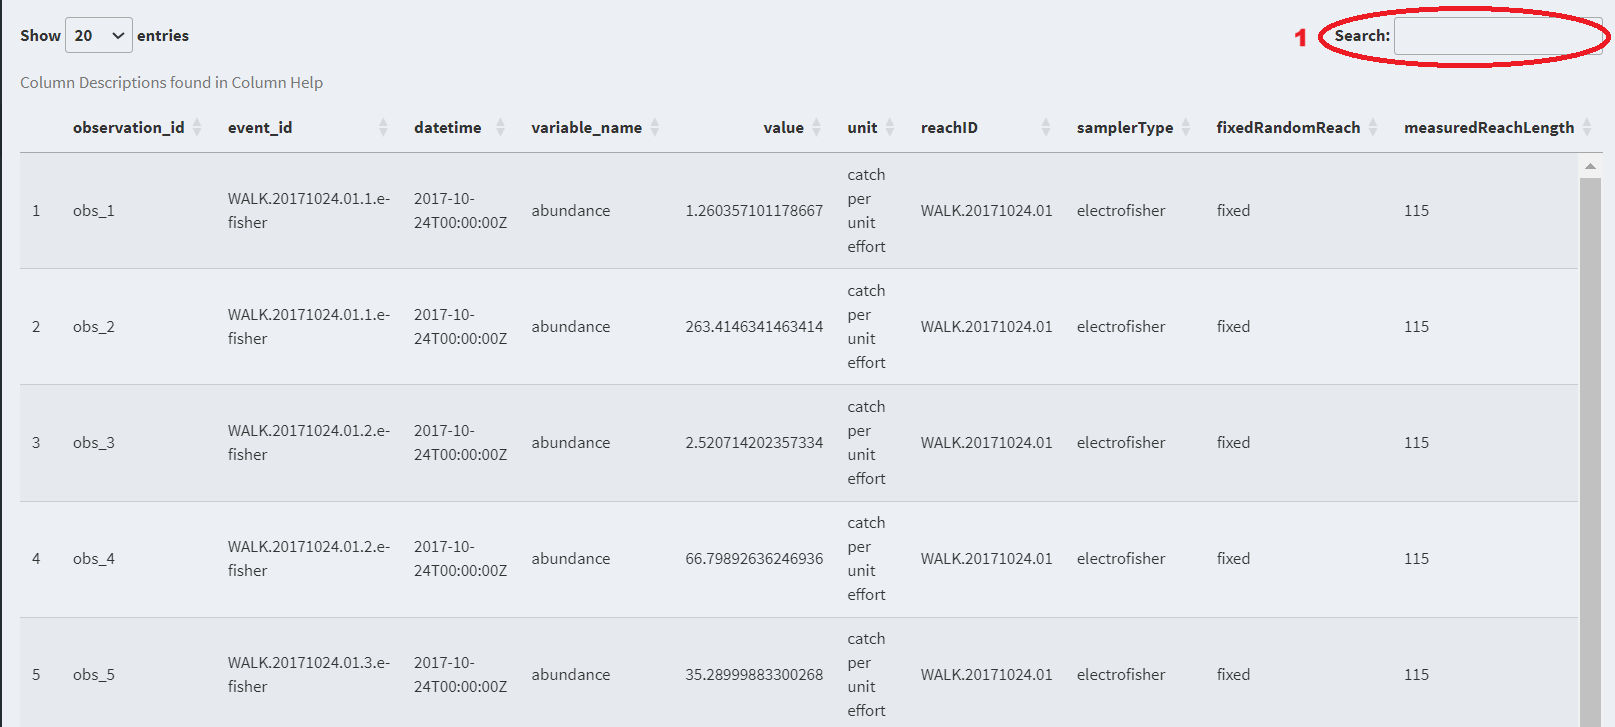
1) On the View Data page you can scroll through and search the dataset using the Search bar at the top of the page.
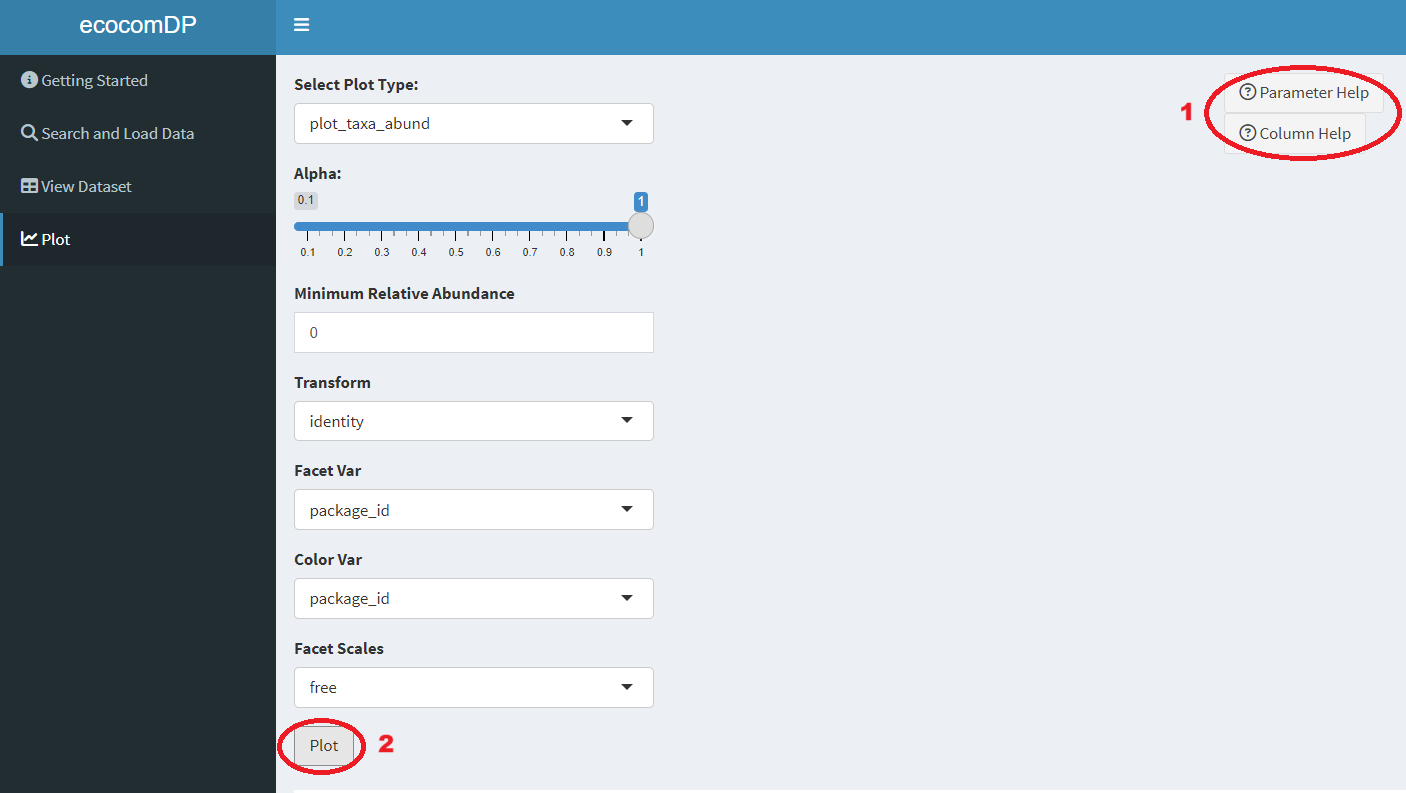
Step 5: Plot Data
1) On the plot page you can select the "Parameter Help" or "Column Help" buttons to get more info on the parameters. The default selected parameters will generate a plot so need to alter them unless desired. 3) Click the plot button to generate the plot or map.